
Tracking Business Performance in Xero
Xero has several tools available to aid your business to make decisions and set you on the right track. These include using Xero reports to track your business finances and understand key performance metrics, to manage money better and plan and make informed business decisions with confidence.
Track your Profitability
There are several reports available that allow you to track the business profitability.
Two figures to focus on are: -
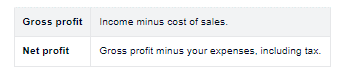
Compare your performance with past periods
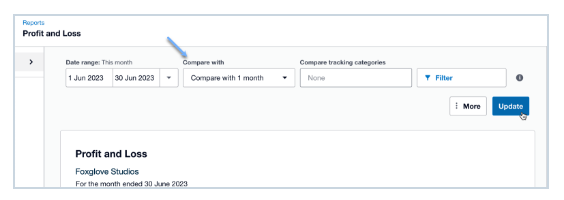
Customise your Profit and Loss report to see how your business is performing compared to previous periods, months or years.
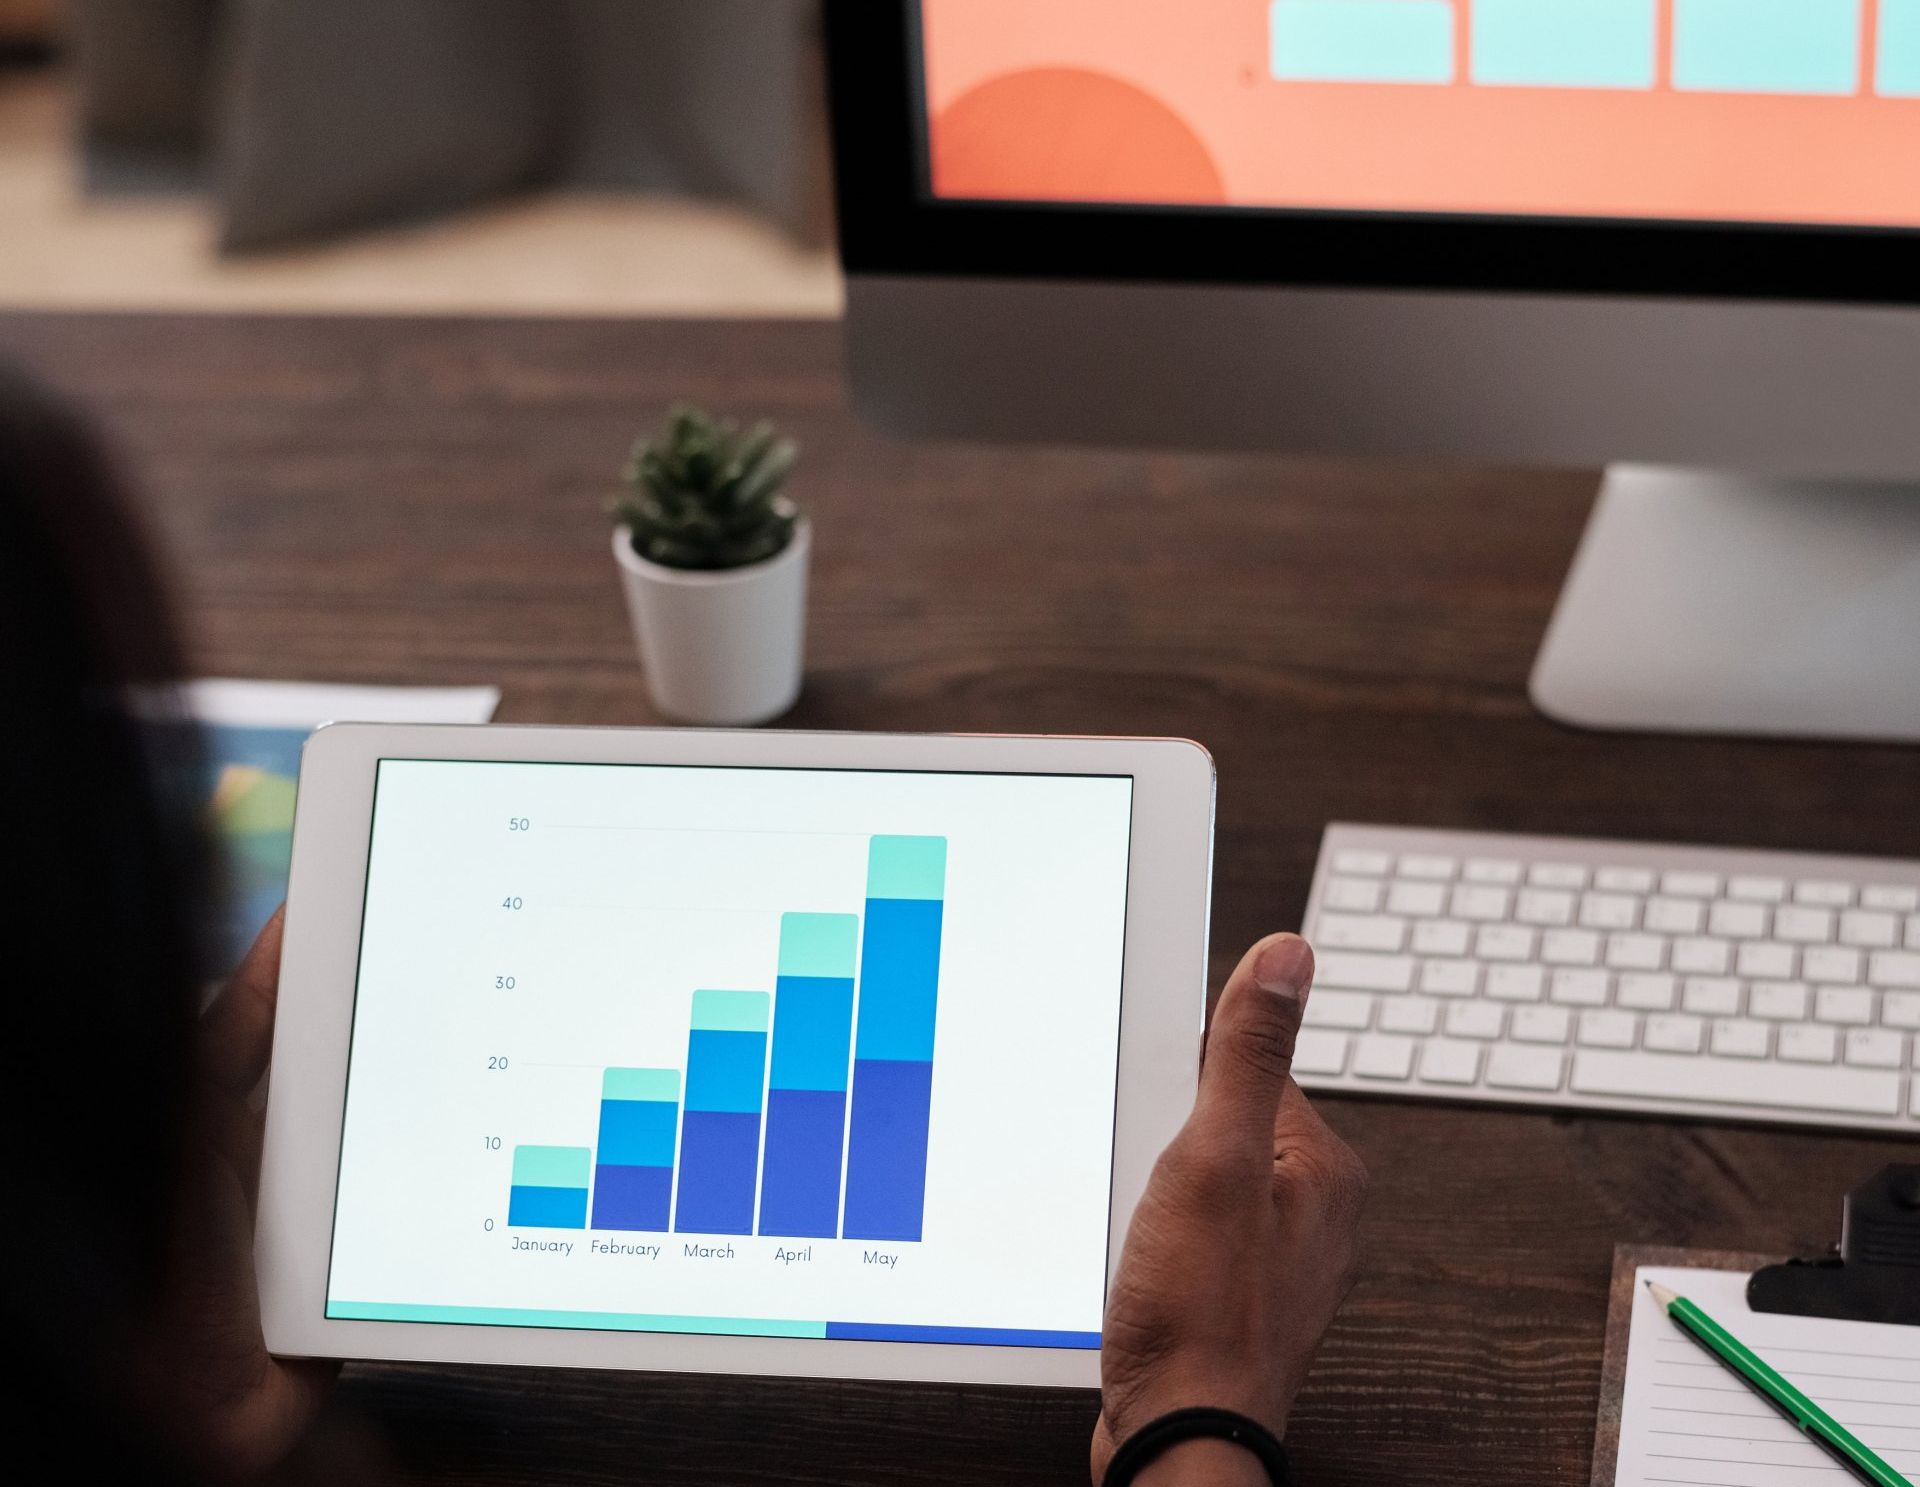
This helps identify trends in your revenue and expenses to see what is working and what could be improved. For example, if you notice revenue increasing month to month, your sales or marketing strategy could be working well. Or, if expenses are steadily increasing, you can evaluate your spending and find ways to cut costs.
Use the filters at the top of the Profit and Loss report to add comparison periods. In the Compare with dropdown, select the past period you’d like to compare, then click Update to rerun the report.
Monitor your assets and Liabilities
Assets are what your business owns, and Liabilities are what your business owes. Monitoring your assets and liabilities will help you determine if your business is solvent. Run the Xero Balance Sheet to monitor your assets and liabilities.
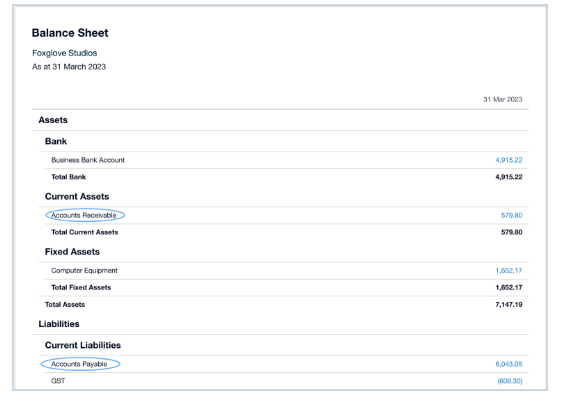
Use the Balance Sheet to gauge how much risk your business carries, the cash you have available to fund your daily operations, and what collateral you can use to secure loans. Two figures to monitor in the balance sheet are: -
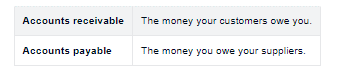
If your accounts receivable is consistently high, review your Aged Receivables Detail report and follow up on customers with overdue balances to collect payments quicker. Offering prompt payment discounts may encourage faster payment too. Or if your accounts payable is always high, run your Aged Payables Detail report to track and plan upcoming payments.
It is important to monitor your cash flow alongside your profit and loss and the balance sheet.
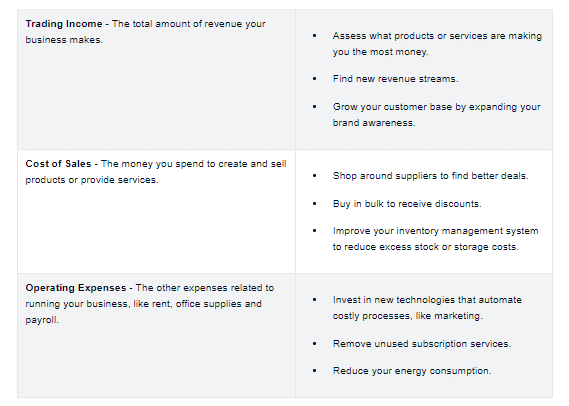
Compare different areas of your business.
Track the performance of different areas of your business to see which areas are making money. This helps you allocate resources effectively in the right direction and make changes to increase sales and reduce expenses.
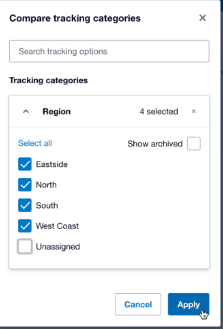
Setting up tracking categories in Xero for the areas of your business you want to compare, like sales by region or expenses by department. When you enter transactions in Xero, assign them to the right category map sales and expenses to the right area.
You can filter the tracking categories to see how these areas are performing in the Profit and Loss Report. Different areas of the business don’t need to be profitable on their own. Its normal for some areas to require more investment than others.
Review your figures against Budget
Preparing a budget helps you understand how much it costs to run your business and generate income. Comparing your actual costs and income to your budget highlights areas where you may be overspending or not meeting your sales goals so you can adjust and get back on track.
You will need to have your budget created in Xero, then compare this with your actual figures by running Xero’s Budget Variance report.
The red and green arrows indicate how your actual figures compare to your budget. A green arrow means your sales are higher or your expenses are lower than planned, while a red arrow means your sales are lower or expenses are higher.
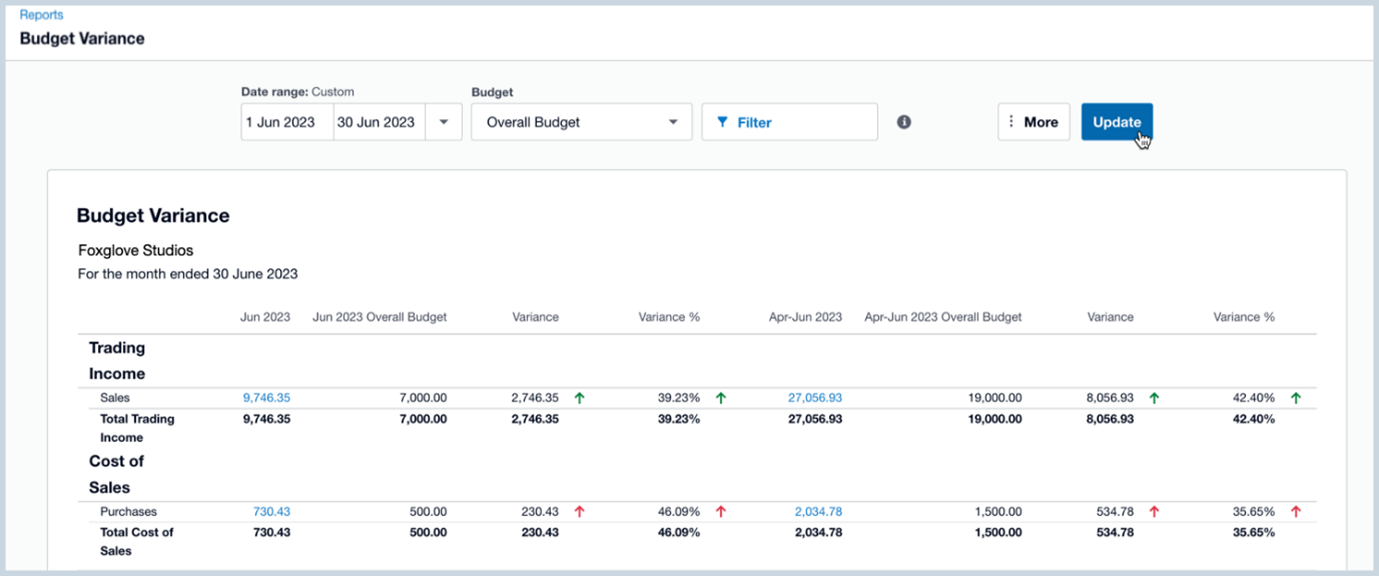
To run the Budget Variance report:
- In the Accounting menu, select Reports, then find and open the Budget Variance report.
- Select a Date range or click the arrow next to the date to choose a set reporting period, like Last month or Month to date.
- Select other options you want the report to show by using the filter option.
- Click Update to run the report.
Review Business Performance
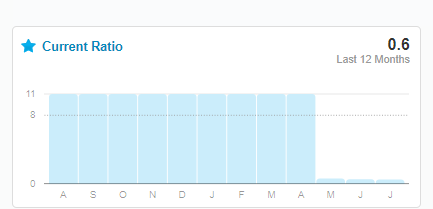
Xero enables the use of charts and graphs to track performance across a wide range of business metrics such as gross profit, net profit on net sales, and debt to equity.
If you have at least a few months of transactions in Xero, you will have a range of graphs on your business dashboard. They can assist in answering questions such as “How much margin do I make on my sales?”, or How easily I can pay my bills?”.
Your business performance graphs form part of the Business Performance Report and are based on equations using account types from your chart of accounts. Monthly and weekly metrics will be complete at the end of the month or week they report on. Extra graphs are based on report codes your accountant or bookkeeper has mapped to your chart of accounts. These advanced ratios will display if your accountant of bookkeeper has added them to your organisation.
The Business Performance Dashboard is available to anyone with the Adviser, standard + reports or even read only access in the organisation. Click the star next to any performance graphs you would like to display on the main dashboard. As per the example below.
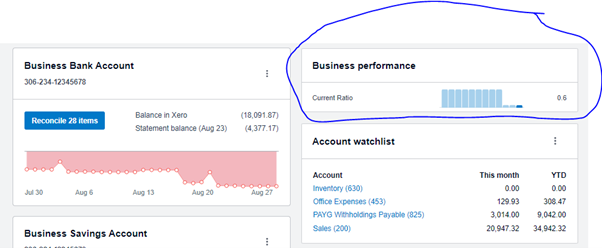
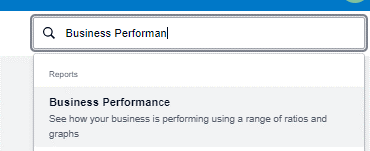
Add the metrics you use most often to the main Xero dashboard, so your favourite measures are right in front of you. Using the Accounting menu, select Reports. Find and open the Business Performance dashboard. You can use the search field in the top right hand corner.
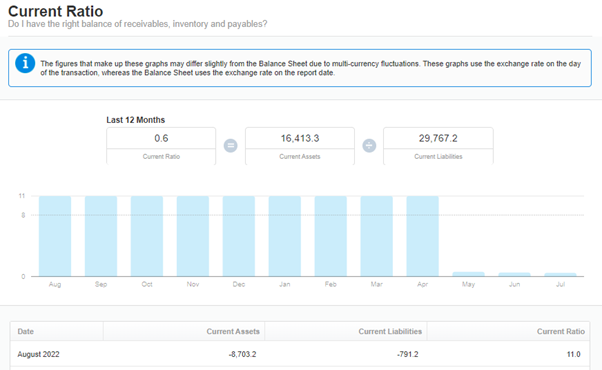
You can drill down from the dashboard to show more detail and get in depth analysis of your numbers. This allows business decisions to be made with confidence.
Identify trends with the Analytics Business Snapshot
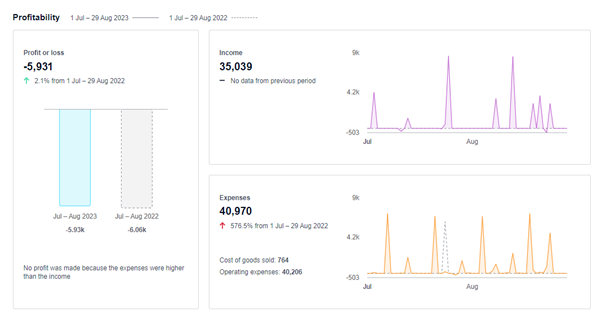
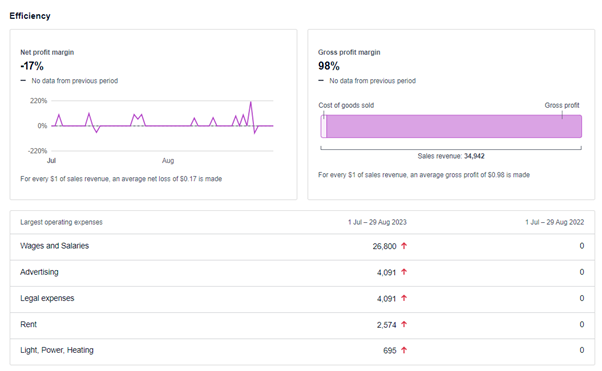
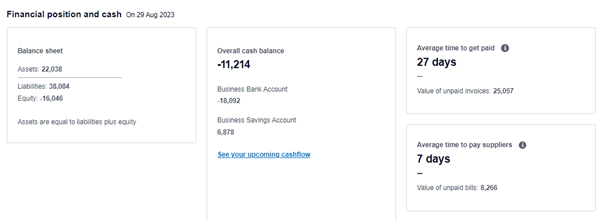
the analytics business snapshot provides further measures to review business performance and view profitability and other key financial metrics. These include a quick overview on profitability, efficiency, and gross profit margin. They also include measures such as average time to be paid and average time to pay suppliers. The ability to repay debts or generate future returns. They also show comparatives against prior years.
Profitability
Efficiency
Financial Position and Cash
Use the dashboard to set and track performance goals and see what is working well and what isn’t. It is always important to discuss these metrics with your accountant or advisor in order to make informed business decisions.
Share this post


QUICK LINKS
Contact Us
Privacy | Terms of Service | Evolve Online Bookkeeping © 2020 All rights reserved | site by mulcahy.com.au/marketing